$1,500,000–$1,600,000
Clean, serviceable older finishes; kitchens and bathrooms largely original.
$481 /SF · -6.2% vs assessment

Seller valuation review
Granville · Richmond
Six-bedroom detached home on two levels. The three condition scenarios reflect the same house and lot.
November 9, 2026 · David Tang & Vicky Wu
$1,500,000–$1,600,000
Clean, serviceable older finishes; kitchens and bathrooms largely original.
$481 /SF · -6.2% vs assessment$1,600,000–$1,700,000
Meaningful kitchen, bathroom or flooring updates; a mix of newer and older finishes.
$512 /SF · -0.2% vs assessment$1,680,000–$1,820,000
Consistent contemporary finish throughout, including kitchen, bathrooms and flooring, with sound major systems.
$543 /SF · +5.9% vs assessmentI have not viewed the interior. These are preliminary condition scenarios; the updated scenario is the working reference until the home is reviewed in person.
Condition ranges and central estimates · CAD millions
The condition differences are valuation scenarios, not renovation budgets or guaranteed returns.
$1,698,000, assuming updated condition.
This is $48,000 (+2.9%) above the updated-condition estimate.
3,225 SF = 1,711 SF main floor + 1,514 SF upper floor. The 5,217 SF lot and 1987 build are confirmed in the assessment record. Garage recorded; capacity is unconfirmed.
The City parcel plan and 2026 aerial show an interior Lynnwood Drive frontage with residential lots behind it. The home does not directly front Granville Avenue or Railway Avenue. Traffic and privacy remain part of the in-person review.
Six bedrooms provide useful family space, but three bathrooms are fewer than the four or five offered by several competitors. No suite income, assembly value or redevelopment premium is included.
October 2026 · Detached homes
Richmond detached prices continued to fall even as fewer homes were newly listed. Sales matched October last year but fell from September. The regional detached sales-to-active ratio improved to 11.6%, still below 12%.
| Market Statistics | Oct 2026 | MoM | YoY |
|---|---|---|---|
| Benchmark price | $1,775,200 | ↓ -0.5% | ↓ -7.0% |
| Sales | 643 | ↑ +12.0% | ↓ -7.2% |
| New listings | 1,471 | ↓ -20.5% | ↓ -14.7% |
11.6% Sales / active listings · ↑ +1.9 percentage points MoM
Greater Vancouver · all residential
15,688↓ -4.3% MoM · ↓ -4.3% YoY
All residential — property-type breakdown unavailable. Richmond detached month-end inventory is not available in the accessed board package. The 140 figure is new listings, not total inventory.
For this home, condition helps separate competing choices, but it does not remove the effect of a softer market. The larger renovated Livingstone sale deserves more weight than asking prices close to $2M.
HPI changes use the board-published percentages. Sales and new-listing changes use the October report’s comparable-period counts, including its revised September total of 574 detached sales. Figures are not seasonally adjusted. A benchmark represents a typical home, not this property.
GVR · 2026-10 ↗ · GVR · 2026-09 ↗8 featured comparables shown
Sale prices and MLS sale dates are shown separately from asking prices. Registration/completion dates have not been independently checked. Laurelwood is shown by sale month because the two records differ by three days.
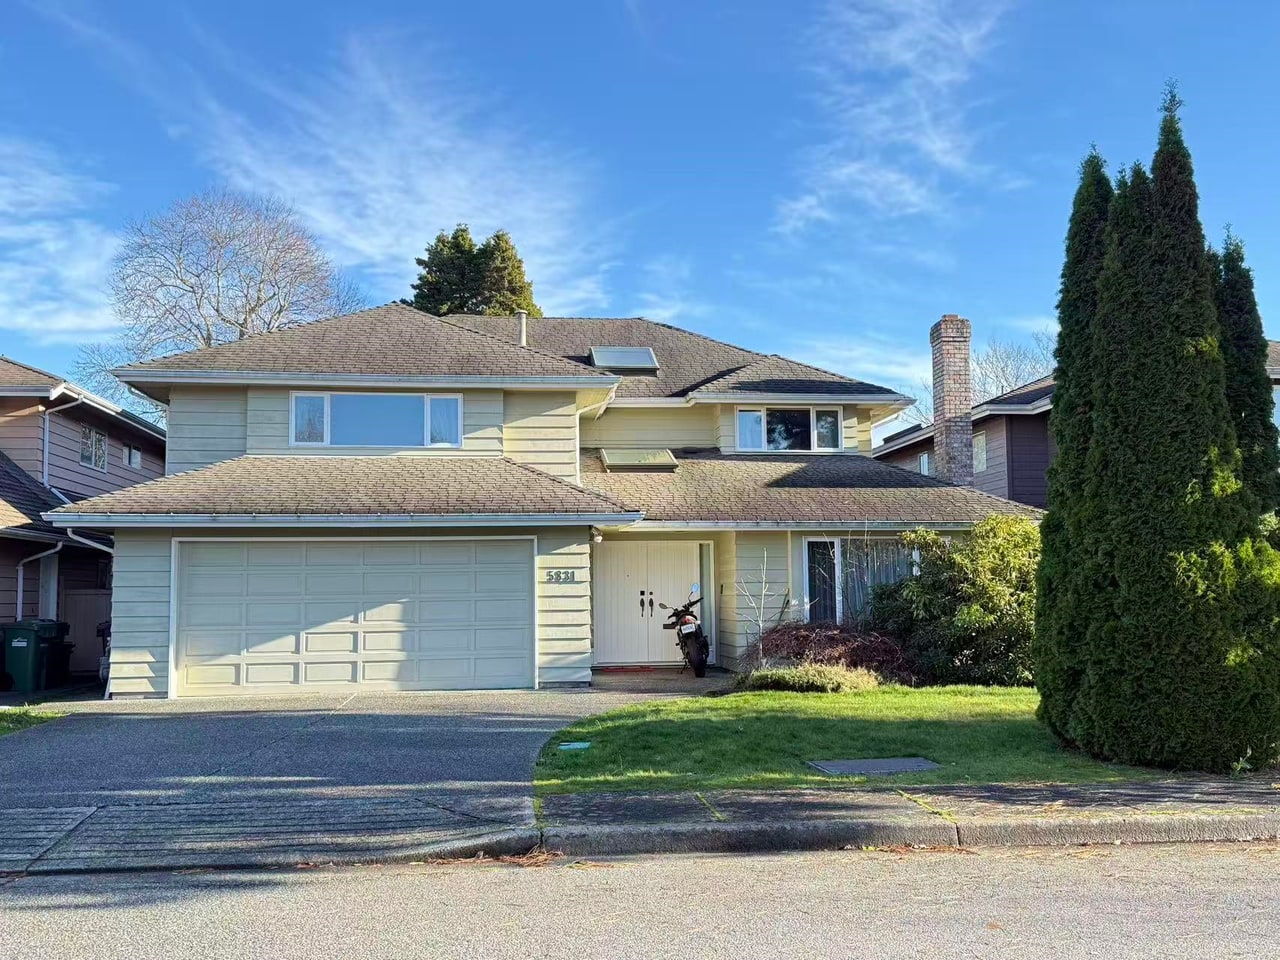 Sold · Sold price
Most direct comparable
Closest size, lot and age match. Updated kitchen, hardwood, roof and boiler; one more bathroom. Its June sale predates the recent price decline. MLS dimensions and room counts are used here.
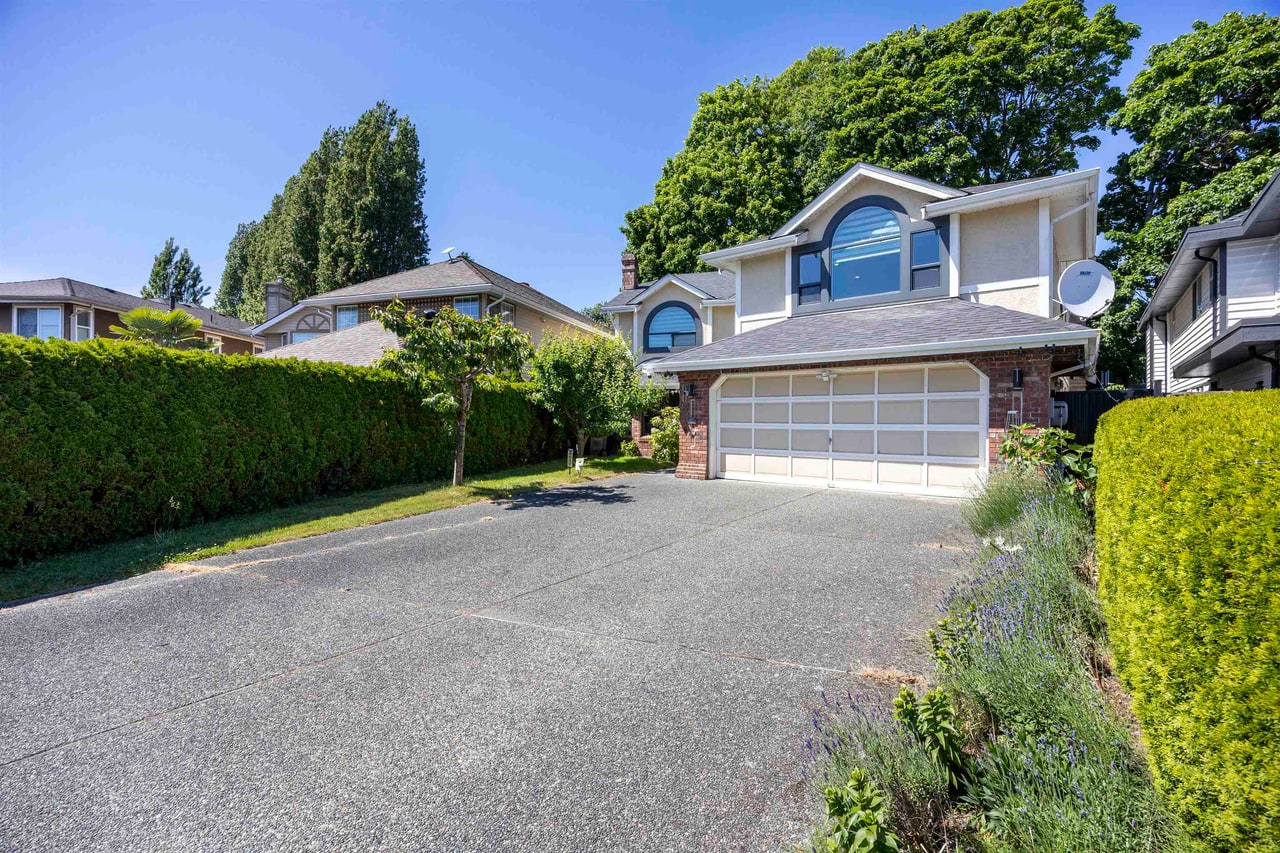 Sold · Sold price
Most direct comparable
Renovated in 2022 with updated bathrooms, appliances and millwork. Larger house and lot, plus an extra bathroom. The $1.765M result is the main check on the fully renovated scenario. Some original architectural finishes remain.
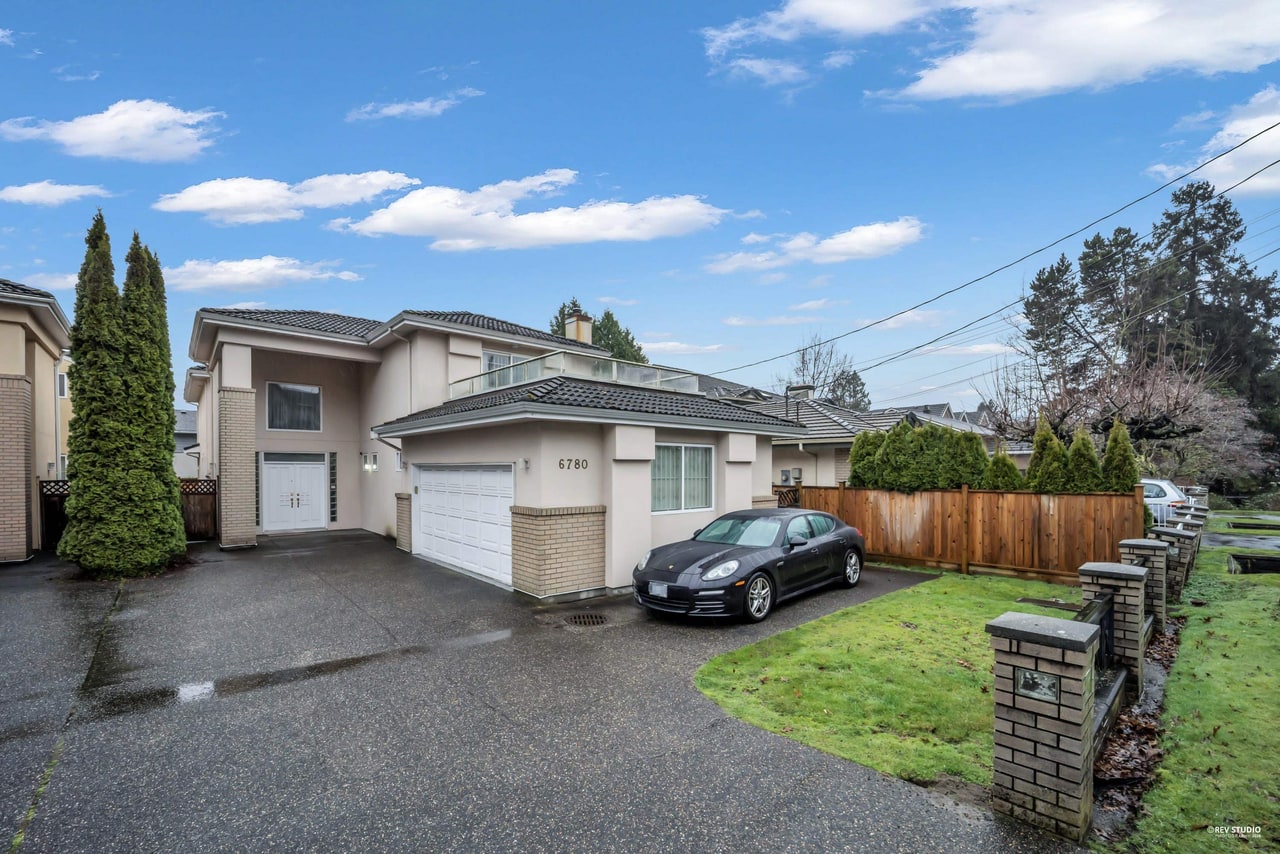 Sold · Sold price
Most direct comparable
A recent lower sale in Granville, one lot from Gilbert Road. Smaller interior but newer construction, a slightly larger lot and an extra bathroom. Proximity to the arterial road is a factor in the lower result.
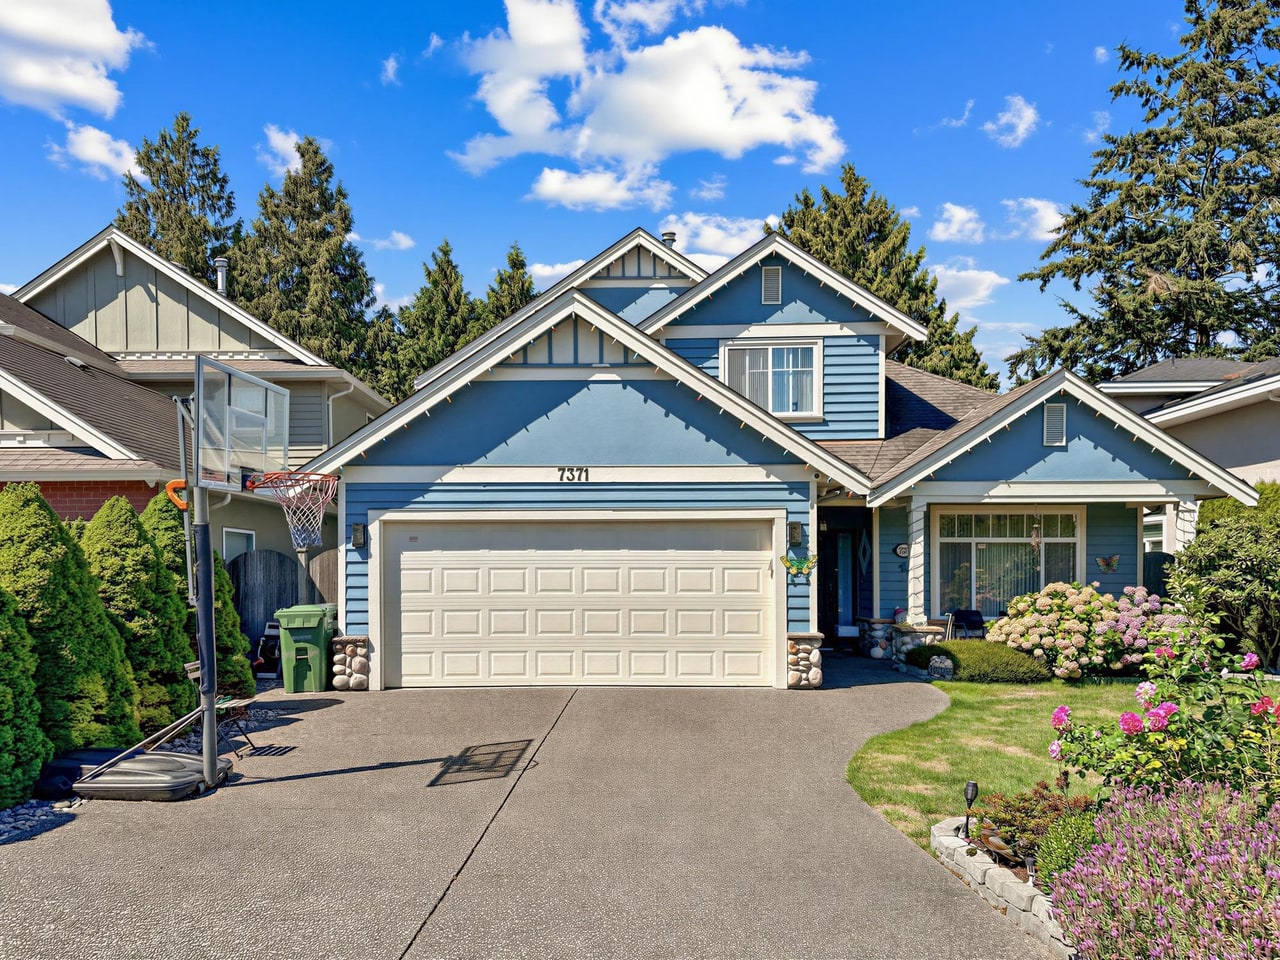 Sold · Sold price
Most direct comparable
Recent upper comparison: 17 years newer, a larger lot, four full bathrooms, high ceilings and a wok kitchen. These advantages explain why its price should not be applied directly to the subject.
Current asking prices checked November 9, 2026. These listings offer alternatives; their asking prices are not completed-sale evidence.
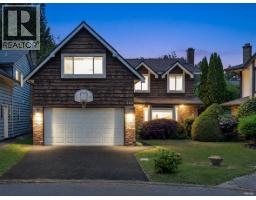 Active · Asking price
Updated kitchen, bathrooms, windows and heating equipment. Smaller and seven years older, but with an extra bathroom. Its $1.598M asking price provides a direct lower-priced alternative to the updated scenario.
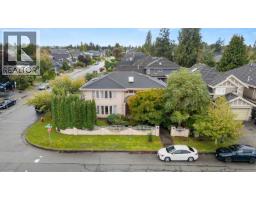 Active · Asking price
Larger home on a 7,700 SF corner lot, two kitchens and triple garage. The extra land and accommodation limit direct comparison. The detailed bathroom schedule includes one powder room.
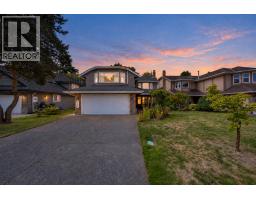 Active · Asking price
Similar age, living area and three-bathroom layout. Updated windows, plumbing and counters; Riverdale location and a 33% larger lot.
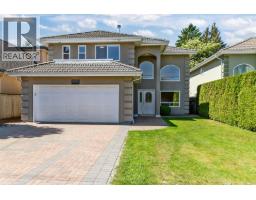 Active · Asking price
Six bedrooms, five bathrooms and a larger lot. Updated floors, paint and insulation. Asking price reduced from $2.19M to $1.99M; an asking comparison, not a sale.
Listing photographs show the named comparable only.
| Property | Sold price | House / Lot · SF | 2026 BC Assessment | Notes |
|---|---|---|---|---|
| Sold7471 Ledway RoadR3151743 · Sep 12, 2026 · Listing DOM 44 | $1,860,000$567 /SF | 3,279 / 8,5205 / 4 · 1995 | $2,216,000-16.1% | Similar living area, but an 8,520 SF lot and triple garage. Larger land component; supporting comparison only. |
| Sold7520 Langton RoadR3163094 · Oct 9, 2026 · Listing DOM 32 | $2,150,000$706 /SF | 3,045 / 6,0465 / 5 · 2008 | $2,253,000-4.6% | Much newer construction, five bathrooms, extensive carpentry and triple garage. A different quality and age tier. |
| Sold6115 Garrison CourtR3163121 · Oct 29, 2026 · Listing DOM 51 | $1,880,000$690 /SF | 2,723 / 4,7225 / 4 · 1997 | $2,041,000-7.9% | Riverdale location; smaller home and lot, but newer construction, four full bathrooms and wok kitchen. |
| Comparison group | N | Mean price | Mean $/SF | Mean vs assessment |
|---|---|---|---|---|
| Four closest sales | 4 | $1,747,750 | $550 | -7.3% |
| Seven selected sales | 7 | $1,840,143 | $595 | -8.3% |
| Active asking prices | 4 | $1,879,500 | $595 | -3.1% |
| Subject · updated scenario | 1 | $1,650,000 | $512 | -0.2% |
Each metric is the arithmetic mean of individual observations. All selected records have a price, area and 2026 assessment. These averages are cross-checks; whole-property differences drive the valuation.
The updated estimate of $1.65M sits below Laurelwood’s $1.726M June sale, allowing for the weaker market and one fewer bathroom. The average-condition scenario is lower where kitchens, bathrooms and finishes remain dated.
The fully renovated estimate of $1.75M is just below the larger Livingstone sale. The $1.82M upper end would require an unusually strong, consistent renovation and favourable layout and presentation. It is not the central expectation. Lindsay’s newer construction and larger lot provide a separate upper check.
All amounts are CAD as of November 9, 2026. Price/SF = price ÷ living area; assessment comparison = (price ÷ 2026 assessment − 1) × 100. Assessments are dated references valued at July 1, 2025. Condition, major systems, alterations, title and any suite approval require confirmation. This is a REALTOR® market review, not a formal appraisal.
The subject uses assessment floor area. Comparables use MLS finished living area. Laurelwood’s MLS shows 3,161 SF and 6 bedrooms/4 bathrooms; assessment records show 3,301 SF and 5 bedrooms/3 bathrooms. The listing basis is retained consistently for its $/SF.
DOM refers to the displayed listing period, not cumulative exposure. Active DOM is the source-displayed figure and may lag. Livingstone and Lindsay had earlier listings; their 7 and 15 DOM figures do not capture the full marketing history.
BC Assessment subject record and nearby sale cross-check; MLS listing histories and property photographs; Greater Vancouver REALTORS® October and September 2026 reports; City of Richmond parcel plan and spring 2026 aerial. Accessed November 9, 2026.


Tang & Kung Real Estate Group · RE/MAX Crest Realty
We can discuss the offer or listing strategy separately.
Download English PDF ↓PDF available in English. The full web report is available in all three languages.